
Multi Modality Tumor Tracking streamline workflow for follow-up of oncology patients
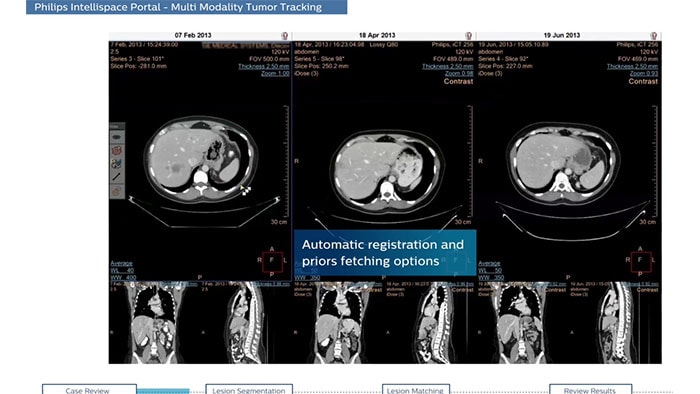
The multi-modality post-processing application is used to display, process, analyze, and quantify anatomical and functional images at one or multiple time points.
Manage different cases with one central solution
Cancer patients require constant vigilance. IntelliSpace Portal provides advanced visualization oncology tools to help you evaluate the stage and treatment response at multiple time points – and efficiently perform essential follow‑ups.
Advanced 3D and graphical tools help you store, present, and communicate clinical information to support diagnostic confidence and productive collaboration.
- Body Perfusion
-
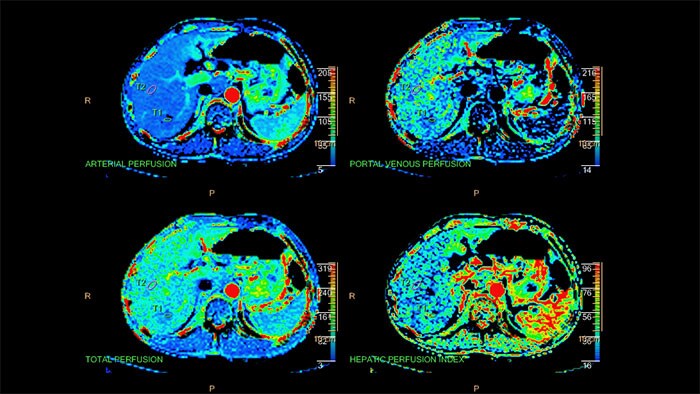
CT Body Perfusion
Quantifiable perfusion
CT Body Perfusion aids in the evaluation of acute or chronic stroke patients, as well as providing whole-organ or single-location liver perfusion.
Benefits
- The package provides motion correction, and enables large coverage / low-dose imaging for superb neuro results.
- Liver Analysis
-
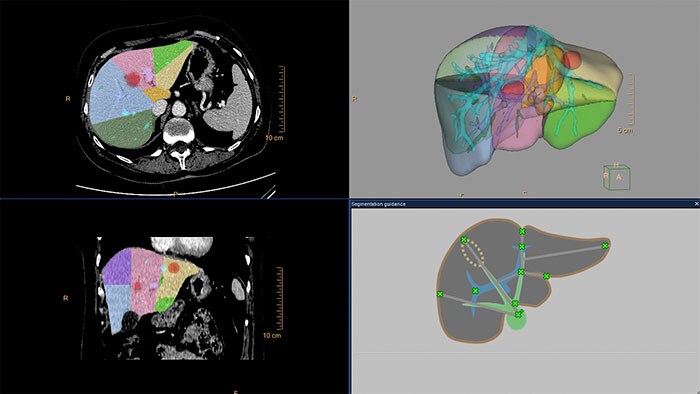
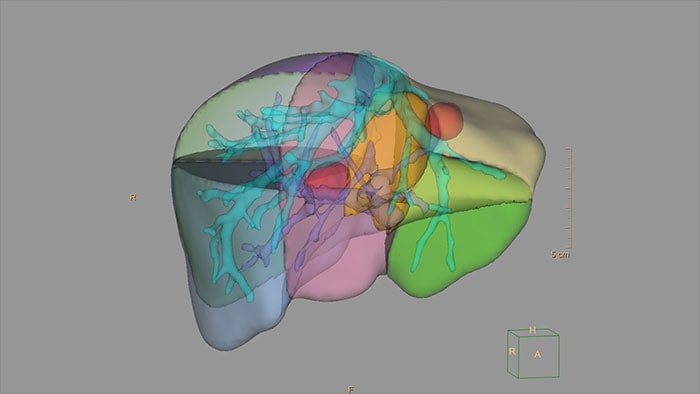
CT Liver Analysis
Advanced Liver segmentation
CT Liver Analysis automatically identifies the liver from a portal venous phase of a tri-phase liver scan. The application provides segmentation tools to facilitate for assessing the liver, hepatic vasculature of individual vascular segments, and physician-identified lesions. Automated segmentation tools can prove to be of use in rapidly extracting clinically reliable whole liver volumes, as evidenced by significantly shortened processing time and improved reproducibility of automated compared to manual approaches.
Benefits
- Automated segmentation tools can prove to be of use in rapidly extracting clinically reliable whole liver volumes, as evidenced by significantly shortened processing time and improved reproducibility of automated compared to manual approaches.
- As a basis for comprehensive analysis and quantification, the liver is segmented semiautomatically using six types of segmentation, including 8-lobe (Couinaud) and 9-lobe.
- The application enables virtual hepatectomy, and provides volumetric calculation of resected and residual liver segments for RF ablation and surgery planning.
- Lung Nodule Assessment (LNA)
-
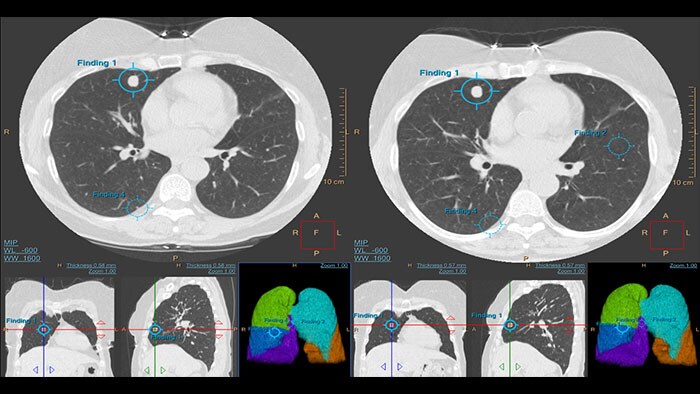
CT Lung Nodule Assessment (LNA)
For diagnostic use and low-dose CT lung cancer screening
An advanced imaging package for the segmentation, quantification and follow-up of physician-indicated lung nodules, that can be used in both diagnostic and screening evaluations, supporting Low Dose CT Lung Cancer Screening.*
Benefits
- One-click volume segmentation with advanced reporting tools to allow efficiently export results in various formats while supporting LungRADS categorization.
- Workflow and decision support tools streamline follow-up readings, together with a Risk Calculator tool based on patient and nodule characteristics for estimation of the probability that lung nodules detected on baseline screening low-dose CT scans are malignant.
- 2017 Fleischner criteria for incidental findings.
- Features pre-filled data including characteristics for each nodule in configurable presets.
*The screening must be performed within the established inclusion criteria of programs/protocols that have been approved and published by either a governmental body or professional medical society. Please refer to clinical literature, including the results of the National Lung Screening Trial (N Engl J Med 2011; 365:395-409) and subsequent literature, for further information. Some functionalities may not be available in all territories. Please contact Philips representative for more details.
- Lung Nodule CAD
-
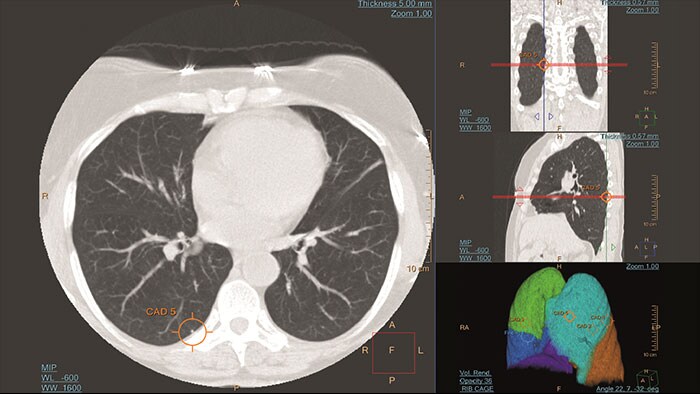
CT Lung Nodule CAD*
Rely on an artificial second reader
Computer-aided detection system for chest multi-slice CT exams
Artificial second reader to support in detection of lesions or nodules which may have been missed.
Benefits
- Automatically
- detect potentially actionable lung nodules – not just round objects or ROIs
- correlate 2D, 3D, and lung maps
- register current and prior nodules
- calculate nodule changes
- Exclude normal anatomy with volumetric segmentation and detect nodules based on size, shape, density, and anatomical context.
- Includes growth report and one-click display of all CAD findings.
*CAD functionality not available for sale in the US.
- Spectral Light Magic Glass
-
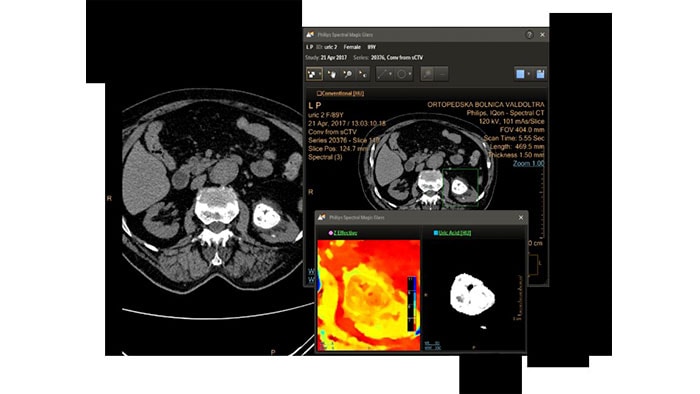
CT Spectral Light Magic Glass
Allows retrospective use of spectral data that was saved as an SBI. Allows reviewing of spectral data and identification of most relevant result to be launched into the conventional CT application for routine work – even for applications that were not developed to support Spectral functionality.
Benefits
- Allows reviewing of spectral data and identification of most relevant result to be launched into the conventional CT application for routine work – even for applications that were not developed to support Spectral functionality:
- Virtual Colonoscopy application
- Liver application
- Trauma Viewer (Acute Multifunctional Review)
- TAVI application
- PAA application
- Brain Perfusion application
- Functional CT (FCT) application.
- Spectral Tumor Tracking
-
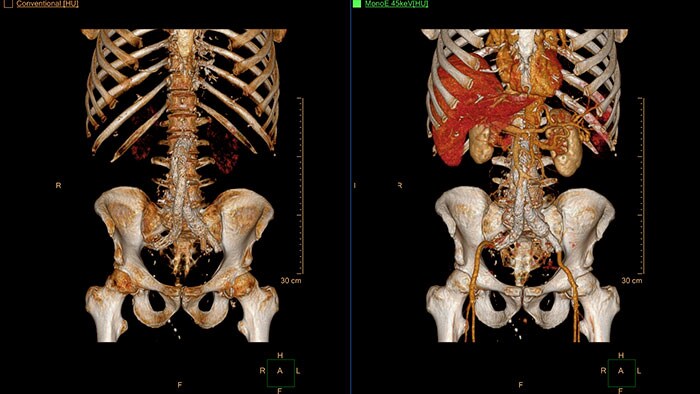
CT Spectral Tumor Tracking
IQon Spectral CT* Functionality
Offers a set of tools for tumor analysis. It allows the user to load several cases in parallel, each taken from a different examination time, segment and edit tumors, and perform lesion viewing and analysis based on different spectral data types.
Benefits
- Viewing tumors with different spectral data types (VNC, iodine map).
- Images at different energy levels (40-200 keV).
- Iodine uptake measurements.
- Intra-lesion material decomposition (calcium, other materials).
- Intra-lesion effective atomic number.
* IQon CT reconstruction provides a single DICOM entity containing sufficient information for retrospective analysis - Spectral Base Image (SBI). SBI contains all the spectrum of spectral results with no need for additional reconstruction or post-processing. Spectral applications are creating different spectral results from SBI.
- Spectral Viewer
-
CT Spectral Viewer
IQon Spectral CT* Functionality
The spectral viewer is optimized for analysis of spectral data sets from the IQon Spectral CT Scanner. Obtain a comprehensive overview of each patient quickly and easily, quantify quickly, and assist in diagnosis. It is designed to accommodate general spectral viewing needs with additional tools to assist in CT images analysis.
Benefits
- Enhances the conventional image by overlaying an iodine map.
- Visualization of virtual non-contrast images.
- Images at different energy levels (40-200 keV).
- Switching to various spectral results can be done through a viewport control.
- Manage presets to create user/site-specific presets.
- Lesion characterization using scatter plots.
- Tissue characterization using attenuation curves.
* IQon CT reconstruction provides a single DICOM entity containing sufficient information for retrospective analysis - Spectral Base Image (SBI). SBI contains all the spectrum of spectral results with no need for additional reconstruction or post-processing. Spectral applications are creating different spectral results from SBI.
- VC Veralook CAD
-
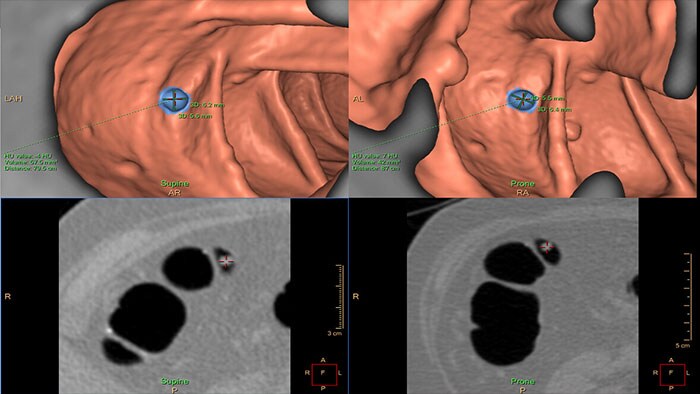
VC Veralook® CAD*
Automatically detect potential polyps in CT colonography exams
VC VeraLook CAD* uses image processing and pattern recognition technology identify colon polyps in CT colonography images, which can help streamline the reading process and improve workflow for radiologists while supporting accuracy, consistency and productivity in colon cancer screenings. Indicated for use as a second read, VeraLook is designed to enhance clinician accuracy and efficiency.
Benefits
- Identify colon polyps to aid in the reading process.
- Designed to enhance clinician accuracy and efficiency by improving detection pedunculated, sessile, flat and fluid submerged colonic polyps.
* VeraLook is a trademark of iCAD inc. for sale only in the US.
- Virtual Colonoscopy
-
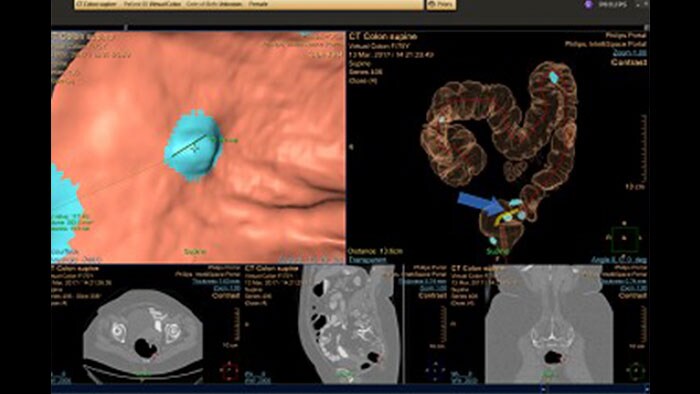
CT Virtual Colonoscopy
Reducing reading times in virtual colonoscopy
Philips exclusive CT Virtual Colonoscopy application enables 3D visualization of colon scans. The application automatically segments the air-filled colon and displays a calculated center line. The Perspective Filet view provides a synchronized display of the full colon surface wall with a single unidirectional view, reducing the need to review in both directions.
Benefits
- Enhancements designed for confidence, productivity and accuracy improvements:
- Colon editing GUI with improved workflow and usability.
- Simplified floating dialog with editing tools per segment.
- New centerline drawing capabilities.
- VC user preference for: colon color, cleaning method, “Save User Settings”.
- New “mirror layout” for dual monitor mode.
- 3D Modeling
-
3D Modeling*
Streamlined modeling workflow optimized for 3D printing
IntelliSpace Portal features a dedicated 3D Modeling application for creating and exporting 3D models. An integrated segmentation environment incorporates IntelliSpace Portal’s segmentation tools in one place designed to simplify workflow.
Benefits
- Supports importing of 3D segmentations from other applications or creating your own custom models directly from DICOM images.
- Offers a suite of clinically focused rendering and editing tools to optimize a model for printing, and allow reflection of the true patient anatomy.
- Physicians may preview meshes against original DICOM imaging, and make adjustments in real time:
- 3D Modeling batches files for easy export in standard formats (i.e. STL) and also in 3D PDF that can be used for communication in department.
- A variety of export options help streamline the transference of your file to a printing service, or for hospital internal use.
*In the USA, 3D models are not intended to be used for diagnostic use.
- Tumor Tracking
-
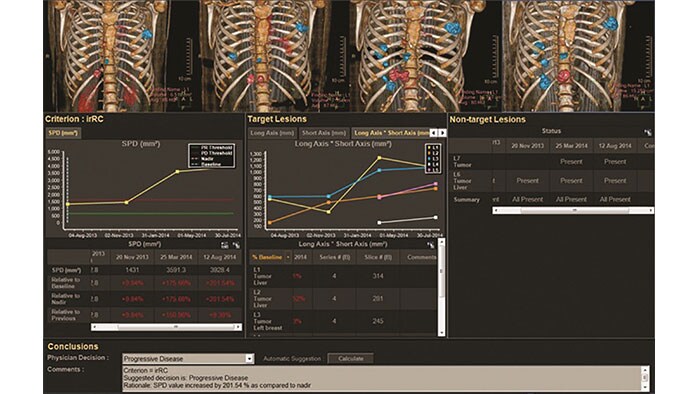
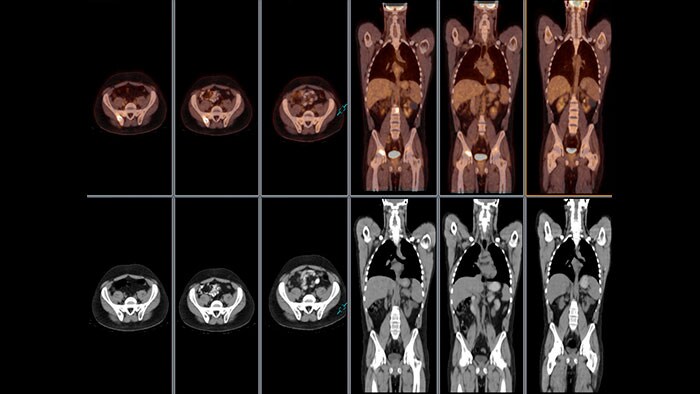
Multi Modality Tumor Tracking (MMTT)
Streamlined workflow for follow up and analysis of oncology patients
Multi Modality Tumor Tracking (MMTT) is a post processing software used to monitor disease state and assess treatment response.
Benefits
- The application is used to display, process, analyze, quantify and manipulate anatomical and functional images for CT, MR, PET/CT and SPECT/CT images and/or multiple time-points.
- Offers enhanced semi-automatic volumetric segmentation, as well as selectable oncology response criteria including standards such as RECIST 1.0, RECIST 1.1, WHO, CHOI, PERCIST, irRC and mRECIST.
- A quantitative overview of volumetric and functional features is organized for quick navigation.
- The application also includes Glucose SUV, an option to calculate lesion uptake normalized by patient glucose level, as well as PET metabolic volume segmentation options based on percentage.
- Tumor Tracking qEASL
-
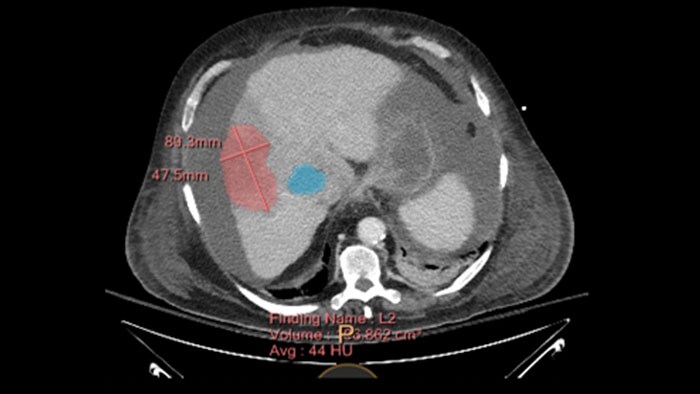
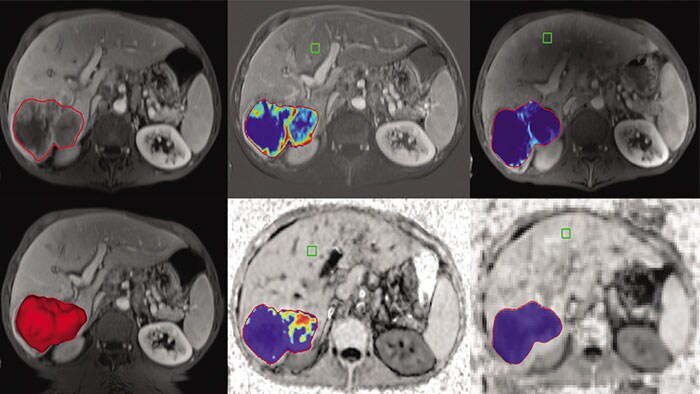
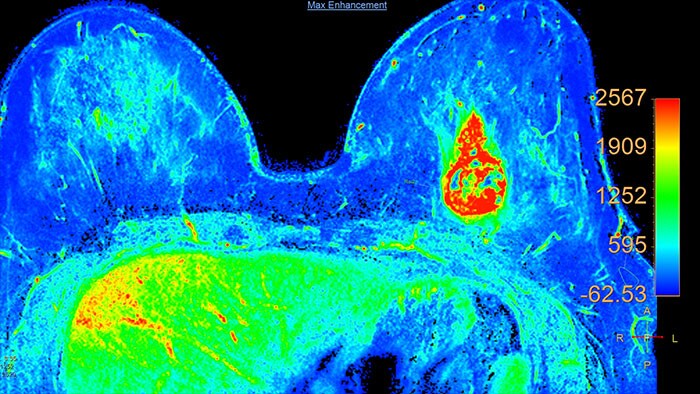
Multi Modality Tumor Tracking qEASL (MMTT qEASL)
Semi-automatic tumor quantification
This semi-automated 3D (Volumetric) tumor response assessment tool, based on EASL (European Association for the Study of the Liver) criteria incorporates functional information from contrast-enhanced scans.
Benefits
- Multi Modality Tumor Tracking supports the creation of Quantitative EASL (qEASL) maps used to measure segmented volumes of interest (VOI) in heterogeneous lesions.
- Data are presented as color map overlaid on the scans to show regional tumor enhancement heterogeneity. The color regions of the segmented lesions are where there is more enhancement than the pre-defined reference region.
- Advanced Diffusion Analysis (ADA)
-
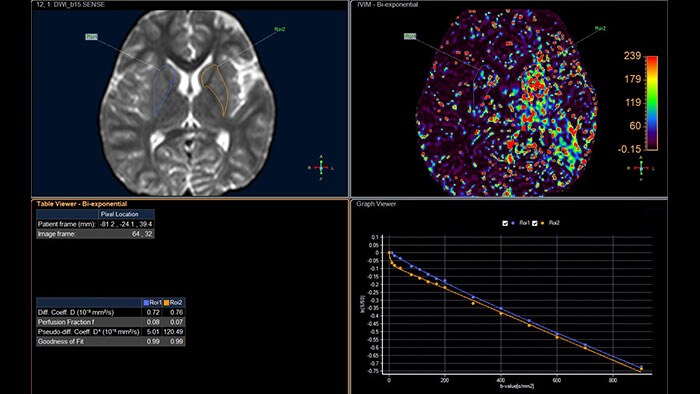
MR Advanced Diffusion Analysis
Enhance your workflow by generating additional cDWI (calculated) images with b-values that were not acquired
MR Advanced Diffusion Analysis (ADA) is a post processing software application used to view, process and analyze MRI Diffusion Weighted Images.
The application calculates and displays cDWI at a b-value of choice and provides advanced supportive analysis and visualization tools of diffusion MRI images and parametric maps.
Benefits
- The application presents a default diffusion analysis model based on the available original DWI images as well as a selection of alternative models including monoexponential, biexponential, simplified IVIM, and kurtosis.
- A ‘goodness of fit’ value and fitted curve show the fitting quality of the selected model.
- The application also provides parametric maps of perfusion fraction (f), pseudo diffusivity (D*), Diffusivity (D) and Kurtosis (K).
- DynaCAD Breast
-
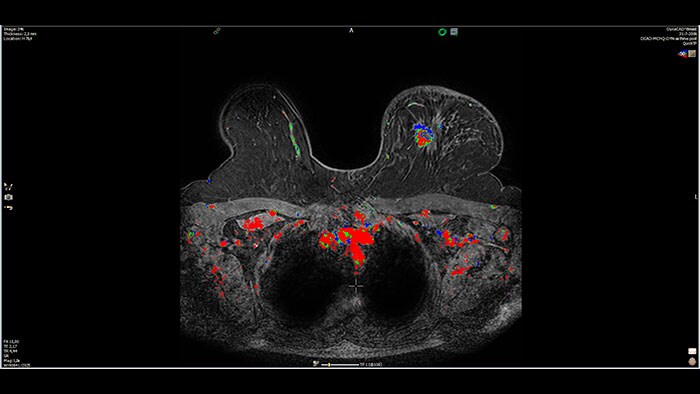
MR DynaCAD Breast*
Purpose-built to streamline workflow and enhance productivity for MRI Breast reading
DynaCAD Breast* has been tailored to enhance the review and analysis of MRI breast studies by providing a flexible workspace with custom hanging protocols and multi-vendor viewing capabilities.
Benefits
- DynaCAD’s automatic segmentation allows for on-the-fly user modification and provides volume analysis, lesion composition statistics, histograms, and a 3D rendered morphological overview.
- Results are automatically incorporated into standardized reports.
- The DynaLOC Breast Interventional Planning software module supports the use of interventional breast coils and MR stereotactic localization devices to perform MR-guided breast interventional procedures.
*Not available for sale in all countries. Please contact local Philips representative for details. Please contact local Philips representative for details on multivendor coverage.
- DynaCAD Prostate
-
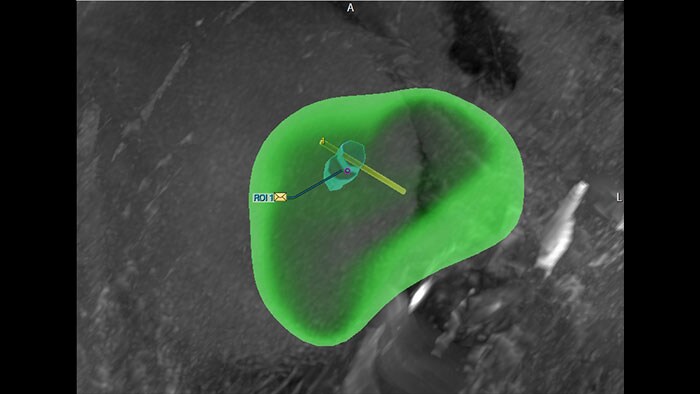
MR DynaCad Prostate*
Designed to enhance confidence, productivity, and accuracy for MRI Prostate reading
DynaCAD Prostate* provides a powerful, easy-to-navigate, multi-vendor MR image analysis application featuring custom hanging protocols with all images synchronized for easy, multi-parametric review.
Benefits
- DynaCAD features automatic segmentation of the prostate gland, providing an overall gland volume estimation. It also features single-click volume analysis, and lesion statistics, and histograms as well as color overlay based on diffusion ADC values.
- Lesions are assessed using the PIRADS v2 scoring and incorporated into standardized reports.
- Lesions identified and marked on the system can be passed to a UroNav system for fusion biopsy.
*Not available for sale in all countries. Please contact local Philips representative for details. Please contact local Philips representative for details on multivendor coverage.
- MobiView
-
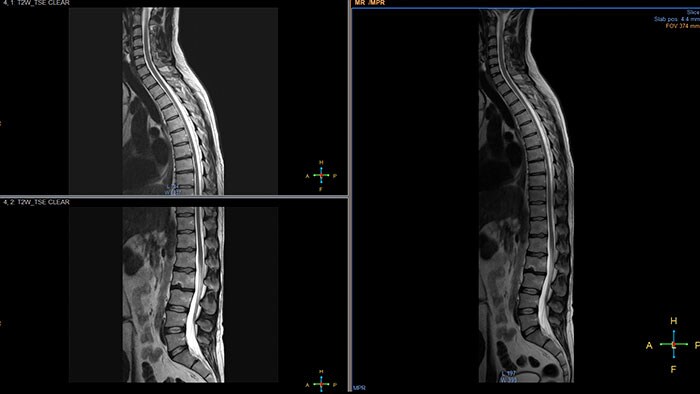
MR MobiView
Automatic review of total body MR data
MR MobiView combines multiple images into a single full-field view to review multi-scanner acquisitions. MobiView is displayed with a single mouse click in the IntelliSpace Portal Multi Modality Viewer. Zero-click display is also available using predefined protocol.
Key clinical cases are MRA run-offs, whole body metastases screening from eye-to-thighs, and total spine views to show the complete CNS. The resulting image series can be viewed, filmed, and exported using a DICOM compliant tool.
Benefits
- Fully automated composition of data sets from multi- station acquisitions into full FOV images.
- Applications include Runoff MRA, Complete CNS and Complete Torso.
- Display composite images stored, filmed and exported via DICOM and PC-compatible formats.
- Images compatible with viewing, measurement, and processing tools, including MIP and MPR.
- Permeability
-
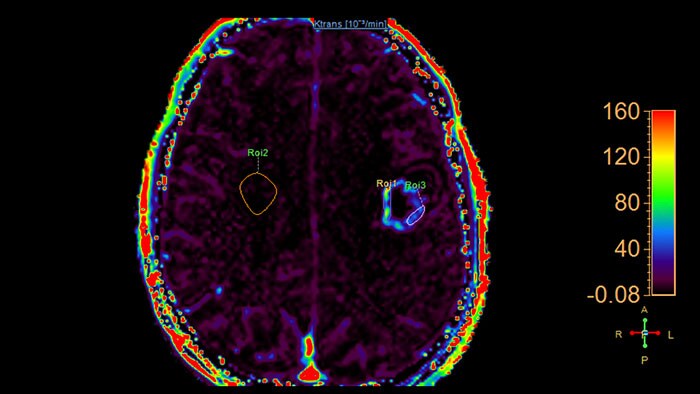
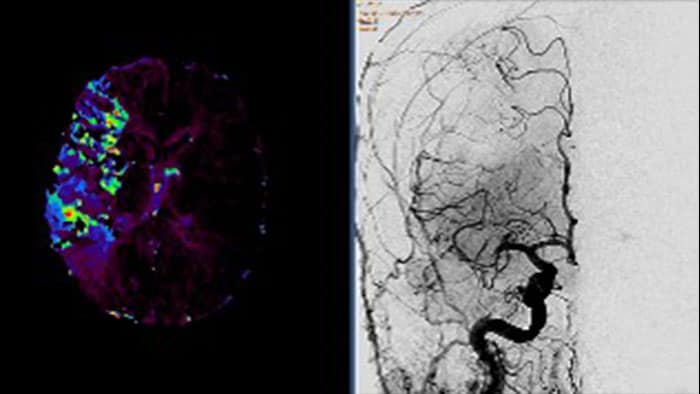
MR Permeability
Lesion characterization by reviewing vascular leakage
MR Permeability helps perform measurements, such as measuring the leakage of gadolinium chelates into the extra-vascular extracellular space (EES). The most important use relates to oncology of the prostate and brain. This tool calculates parametric maps such as Ktrans and Kep which is related to tracer kinetics behavior.
Benefits
- Gain a comprehensive overview and characterization of leakage of gadolinium chelates into the extra-vascular extracellular space (EES) by quantifying Ktrans and Kep.
- Review includes comparison with other anatomicals, viewed in the same orientation as the source data.
- Detailed graph analysis to analyze uptake curves of drawn regions of interest, including the display of the manually defined or model-based AIF.
- SpectroView
-
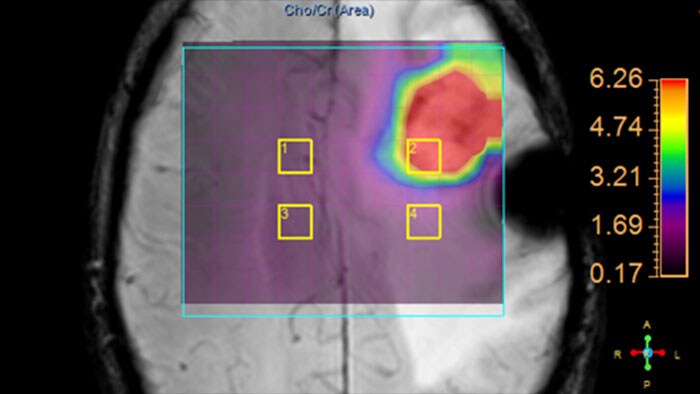
MR SpectroView
Understanding the metabolic changes with MR
Proton spectroscopy data can be analyzed with the MR SpectroView application, which enables anatomy-based automatic generation of the right processing presets based on enhanced DICOM data. The package provides task guidance for easy adaptations of the final processing settings.
Benefits
- Clinically driven protocols, with task guidance for fast adaptations.
- Rich set of options to optimize fitting, create metabolite or ratio data or maps.
- Quality indicators based on line widths of the unsuppressed water peak and SNR of the highest metabolite peaks.
- Subtraction
-
MR Subtraction
Improve image contrasts for MR data in dynamic studies
MR Subtraction enables subtraction calculations of dynamic studies and also provides for computation of magnetization transfer contrast ratio (MTC) images from an appropriate set of input images.
Benefits
- Weighting factors can be defined to influence the subtraction or MTC outcome.
- T1 Perfusion
-
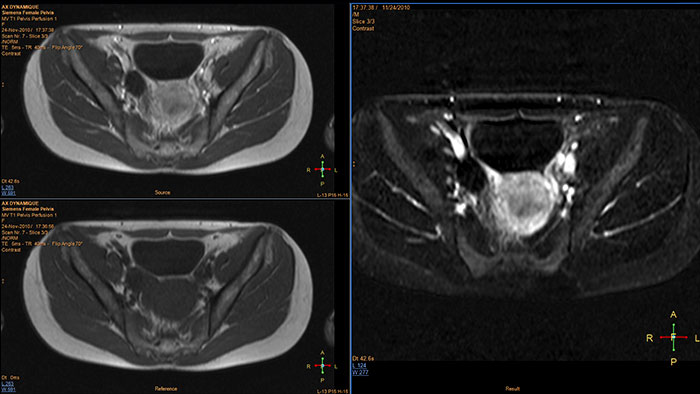
MR T1 Perfusion
Support in assessing lesions by reviewing blood supply characteristics
MR T1 Perfusion Analysis produces measurements of relative enhancement, maximum enhancement, time to peak (TTP), and wash-in rate. Registration of the source images in the dynamic series can remove motion artifacts, and temporal and spatial smoothing of the input data can be performed to improve SNR.
Benefits
- User-selected color-coding of the functional data.
- The maps can be viewed and stored as overlays on anatomical reference images.
- The opacity of the overlay is user-defined.
- ROI analysis is also included.
- Wash-out calculation for better handling large number of time points.
- Review
-
NM Review
NM Review provides a powerful MI and multi-modality image review and analysis environment for clinical evaluation of MI planar, SPECT, SPECT/CT, PET/CT, and PET/MR examinations.
Benefits
- Layouts Selection, allows user to define different layouts for different presets. For each preset the user will have 4 different layouts.
- MPR, MIP and fused 3D volume display.
- Continuous scrolling option.
- 2D and 3D SUV measurements: SUV Body Weight, SUV Lean Body Mass, SUV Body, Surface Area, and SUV Body Mass Index.
- Automated 3D segmentation of lesions based on SUV value or percentage of SUV max, and the ability to export 3D contours in DICOM-RT Structure.
- Set format to radiation therapy planning systems.
- Viewing (in MMV)
-
XA Viewing (in MMV)
Comprehensive reviewing tool for multiple modalities, all in a single viewer
The Multi Modality Viewer (MMV) now supports viewing and post processing of angiography images and series. Review and perform analysis of angiographic imaging alongside other modalities for a comprehensive review of the patient case. Perform vascular processing of images (Digital Subtraction Angiography) – subtraction, pixel shifting and land marking. Include key images into the generic MMV report. Prior to the intervention, relevant diagnostic (MR and or CT) data can be bookmarked and automatically retrieved upon patient selection in the Allura, or the Azurion suites.
Benefits
- Enable a comprehensive review of a patient case across all modalities – CT/MR/NM/US/Angio – in a single environment.
- Advance viewing and post-processing (DSA) of angiographic images and series.
- Annotate and perform basic measurements on images (provided the image is pre-calibrated).
- Automatic retrieval of relevant diagnostic (CT and/or MR) data to support the intervention using iBookmark.
- Reporting also supported; key images can be send to an MMV generic report.